

In 2025, Google handles an estimated 13.6 billion searches per day, making it the world’s most-used search engine.
Search behavior is evolving: over 69% of U.S. Google traffic comes from mobile devices, and more than 55% of users are aged 18–34.
These Google search statistics provide a data-backed look at trends, user behavior, and search intent, helping marketers, SEOs, and business owners optimize their strategies and stay ahead.
Top Stats
- Google processes 16.4 billion searches per day in the U.S., or 11.4 million per minute.
- The average Google user performs 4.2 searches per day (median 1.8).
- Google’s global market share is 89.57% in 2025, with around 5.06 billion users worldwide.
- Over 55% of Google users are aged 18–34, and 69.95% of U.S. traffic comes from mobile devices.
- 52.65% of searches are informational, while only 0.69% are transactional.
Let’s dive into the full data, trends, and insights behind these numbers.
How Many Google Searches Are There Per Day?
The latest data shows Google processes around 16.4 billion searches per day in the US alone. This lines up with Google’s own statement of handling over 5 trillion searches annually, which equals about 13.69 billion searches per day worldwide (Google).
That scale translates to nearly 190,000 searches every second, or around 11.4 million every minute.
Average Google Searches Per User
While the average Google user performs 4.2 searches per day, the median is just 1.8. This means a relatively small number of heavy users drive a large share of total searches.
Searches per user (United States):
| Timeframe | Number of Searches |
|---|---|
| Daily | 4.2 |
| Weekly | 29.4 |
| Monthly | 126 |
| Yearly | 1,533 |
Google Unique Monthly Visits (July 2025):
Google’s reach extends across many country-specific domains. In July 2025, google.com recorded 5.8 billion visits in the US, while other domains such as google.co.in in India and google.com.br in Brazil attracted tens of millions of visits each (Semrush).
| Google Domain | Country | Monthly Visits |
|---|---|---|
| google.com | USA | 5.8B |
| google.co.in | India | 38.2M |
| google.com.br | Brazil | 41.3M |
| google.co.uk | UK | 28.7M |
| google.de | Germany | 28.7M |
| google.co.id | Indonesia | 95.5M |
| google.co.jp | Japan | 24.1M |
| google.ca | Canada | 15.2M |
| google.com.mx | Mexico | 14.4M |
| google.co.kr | South Korea | 15.3M |
| google.com.hk | Hong Kong | 16.2M |
| google.com.pk | Pakistan | 2.6M |
| google.com.ng | Nigeria | 911K |
| google.ru | Russia | 10.7M |
| google.cn | China | 2.2M (low due to ban) |
Fast-growing regions like India, Brazil, and Indonesia highlight the expanding global opportunity for brands looking beyond the US.
The Rise of Zero-Click Searches
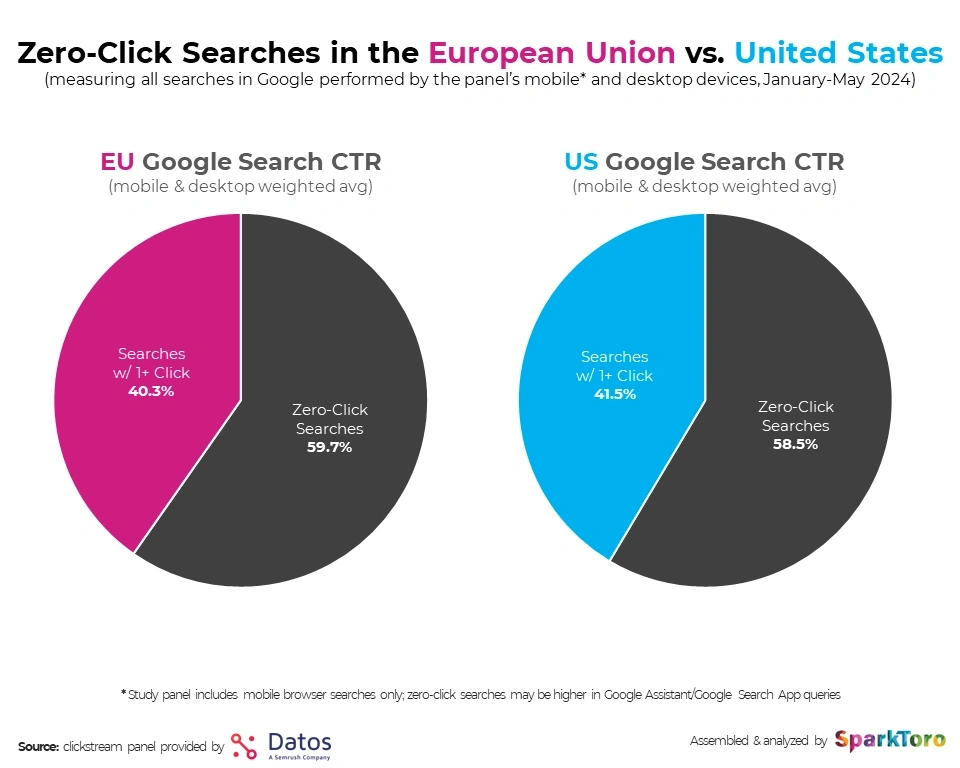
Not all searches end in a click. According to Datos, 58.5% of US searches are zero-click, while in the EU that number rises to 59.7% (SparkToro).
This trend is accelerating with AI Overviews. Research from Exploding Topics shows only 7.71% of users consistently follow links provided by AI Overviews, and just 8.5% always trust the information they display (Exploding Topics).
Number of Google Searches Over Time
Google has come a long way since its early days in 1998. In its first year, the search engine handled only about 10,000 searches per day. Fast forward to today, and Google is projected to process more than 13.6 billion searches daily in 2025. That’s nearly 5 trillion searches per year.
This growth shows not only how dominant Google has become but also how much our daily lives now depend on search.
The table below highlights how the number of daily Google searches has scaled over time, based on available estimates and projections.
| Year | Daily Searches |
|---|---|
| 1998 | 10,000 |
| 1999 | 3,000,000+ |
| 2000 | 18,000,000 |
| 2001 | 55,000,000+ |
| 2004 | 200,000,000 |
| 2009 | 1,000,000,000+ |
| 2012 | 3,300,000,000 |
| 2016 | 5,400,000,000+ |
| 2024 | 8,300,000,000+ |
| 2025 (projected) | 13,600,000,000+ |
Most Searched Things on Google
Google’s most searched queries reveal what billions of people around the world care about—from directions and sports to weather and entertainment. In July 2025, the top global search terms ranged from essential daily needs like maps and weather to event-driven spikes such as Ind vs Eng cricket matches and Wimbledon.
Here are the top 10 most searched things on Google (July 2025):
| Rank | Search Term | Traffic Share | Monthly Traffic | July 2025 Volume | Traffic Leader |
|---|---|---|---|---|---|
| 1 | maps | 1.00% | 38,953,241 | 70,536,801 | google.com |
| 2 | ind vs eng | 0.71% | 27,714,336 | 277,818,676 | youtube.com |
| 3 | weather | 0.58% | 22,734,637 | 194,101,190 | weather.com |
| 4 | flamengo | 0.38% | 14,948,465 | 70,667,863 | youtube.com |
| 5 | superman | 0.38% | 14,810,697 | 48,208,970 | youtube.com |
| 6 | y | 0.35% | 13,781,127 | 17,765,755 | youtube.com |
| 7 | ufc | 0.32% | 12,363,877 | 55,127,513 | youtube.com |
| 8 | wimbledon | 0.31% | 11,920,812 | 100,439,973 | wimbledon.com |
| 9 | real madrid | 0.27% | 10,466,730 | 60,657,651 | realmadrid.com |
| 10 | map | 0.25% | 9,707,128 | 18,256,357 | google.com |
Source: Similarweb
Google’s Worldwide Market Share
Google has long dominated global search, but recent data shows its market share is starting to slip. In 2024, Google held 91.47% of the worldwide search market. By July 2025, this had fallen slightly to 89.57%.
With 5.65 billion internet users globally, this means roughly 5.06 billion people actively use Google. In June 2025 alone, Google received 96.5 billion visits according to Exploding Topics.
Some countries, however, restrict access to Google. China, with over a billion internet users, bans Google entirely, while Iran (73.14 million users) and Syria (6.25 million users) also block access. These restrictions partially explain why Google’s total user count is lower than the total global internet population.
Here’s a look at how Google’s global market share has changed since 2015:
| Year | Market Share | Annual Change |
|---|---|---|
| 2015 | 89.62% | – |
| 2016 | 91.01% | +1.55% |
| 2017 | 92.78% | +1.94% |
| 2018 | 91.74% | -1.12% |
| 2019 | 92.86% | +1.22% |
| 2020 | 92.51% | -0.38% |
| 2021 | 91.86% | -0.70% |
| 2022 | 91.90% | +0.04% |
| 2023 | 92.90% | +1.09% |
| 2024 | 91.47% | -1.43% |
| 2025 | 89.57% | -2.07% |
2025 marks Google’s steepest decline in a decade, signaling that while AI-driven search is not yet drastically impacting usage, it could be contributing to the first shifts in Google’s dominance.
Google Usage by Region
Google remains the most widely used search engine globally, but its traffic share varies significantly by country. As of July 2025, the United States leads in total Google.com traffic, accounting for 20.98% of all web traffic. Japan follows with 6.68%, India at 5.59%, and Brazil with 4.48%.
This ranking only reflects traffic to google.com and does not include activity on Google’s country-specific domains.
Top Countries by Google.com Traffic Share (July 2025):
| Rank | Country | Traffic Share |
|---|---|---|
| 1 | United States | 20.98% |
| 2 | Japan | 6.68% |
| 3 | India | 5.59% |
| 4 | Brazil | 4.48% |
| 5 | Germany | 3.67% |
Countries Where Google Dominates Search Traffic
While the US drives the most Google traffic in volume, Google’s dominance relative to other search engines is higher in other countries. For example, Nigeria leads globally, with 98.69% of search traffic coming from Google, followed closely by Israel (98.26%) and Hungary (97.94%).
Top 10 Countries by Search Traffic Driven by Google (July 2025):
| Country | Percentage of Search Traffic from Google |
|---|---|
| Nigeria | 98.69% |
| Israel | 98.26% |
| Hungary | 97.94% |
| India | 97.16% |
| Egypt | 96.61% |
| Ghana | 96.59% |
| Saudi Arabia | 96.54% |
| Thailand | 96.12% |
| Kenya | 96.08% |
| Romania | 96.07% |
Even major countries like the US (86.93%), Canada (89.53%), and Mexico (89.5%) fall below this level, showing that Google’s true search dominance is stronger in other regions.
Other Notable Countries:
| Country | Google Search Traffic Share |
|---|---|
| Spain | 94.3% |
| South Africa | 93.61% |
| UK | 93.39% |
| Indonesia | 92.98% |
| Australia | 92.33% |
| Brazil | 91.91% |
| Worldwide | 89.57% |
| France | 87.74% |
| USA | 86.93% |
| Turkey | 60.25% |
| South Korea | 43.02% |
| Russia | 21.72% |
| China | 1.37% |
The data highlights that while Google is nearly ubiquitous worldwide, local regulations, alternative search engines, and regional preferences can significantly affect its share.
Sources: SimilarWeb, Data Reportal
Google Search User Demographics
Google traffic today is heavily mobile-driven. Globally, around 64% of website traffic comes from mobile devices, and much of this flows through Google. In the US, 69.95% of Google traffic comes from mobile, while desktops account for just 30.05%. In Japan, where Google.com receives its second-largest share of traffic, 82.92% of visits come from mobile devices.
Gender trends are also interesting. While many might expect a fairly even split, Google users tend to skew male. On Google.com, 64.78% of traffic is male, compared with 35.22% female. However, this varies widely across country-specific domains.
Google Traffic by Gender:
| Domain | Male | Female |
|---|---|---|
| Google.com | 64.78% | 35.22% |
| Google.co.uk | 39.57% | 60.43% |
| Google.com.mx | 47.28% | 52.72% |
| Google.com.ng | 62.06% | 37.94% |
| Google.com.pk | 81.54% | 32.17% |
| Google.co.in | 77.11% | 22.89% |
Age demographics show that younger users dominate Google traffic. More than 55% of visitors are aged 18–34, while users 55 and older only make up about 16.13% of traffic.
Google Traffic by Age Group:
| Age Group | Percentage |
|---|---|
| 18-24 | 27.7% |
| 25-34 | 27.68% |
| 35-44 | 19.01% |
| 45-54 | 12.68% |
| 55-64 | 7.23% |
| 65+ | 4.76% |
This demographic data highlights that mobile-friendly content and platforms targeting younger audiences are essential for SEO and digital marketing success.
Source: Semrush
Types of Google Searches
Google searches can be categorized by search intent, and understanding these types is crucial for SEO and digital marketing strategies.
According to a survey conducted by Datos, 44.19% of Google searches are brand-related, reflecting the dominance of recognizable companies in search queries.
When broken down by intent, the majority of searches are informational, where users are simply looking for answers, guidance, or knowledge. Transactional searches where a user is ready to buy or sign up make up a very small portion of queries.
Search Queries by Intent:
| Search Intent | Volume of Queries |
|---|---|
| Informational | 52.65% |
| Navigational | 32.15% |
| Commercial | 14.51% |
| Transactional | 0.69% |
For marketers and SEOs, targeting informational and navigational searches offers the most opportunities for content creation and brand visibility. Tools like the Semrush Keyword Magic Tool allow you to filter and sort keywords by search intent to focus your strategy effectively.
Source: SparkToro
Conclusion
Even with the rise of AI and changing search habits, Google remains the undisputed leader in online search.
AI-powered search is starting to influence how people find information, but its impact on Google’s market share is still minimal making it a trend worth watching for marketers and SEOs.
For a deeper dive into search trends, user behavior, and key insights, check out our Google Search Stats post to see the latest numbers and actionable data.