

TikTok is now the 5th most-used social platform worldwide, with 1.59 billion monthly active users and over 1.925 billion total users globally.
In the U.S. alone, TikTok has 170 million monthly active users, making it one of the top platforms for both content consumption and brand discovery.
In this report, you’ll find up-to-date TikTok statistics covering:
Let’s dive into the data.
How Many People Use TikTok?
As of now, TikTok has 2.05 billion active users, and this number is only set to rise. By 2025, TikTok is expected to reach an impressive 2.14 billion users globally.
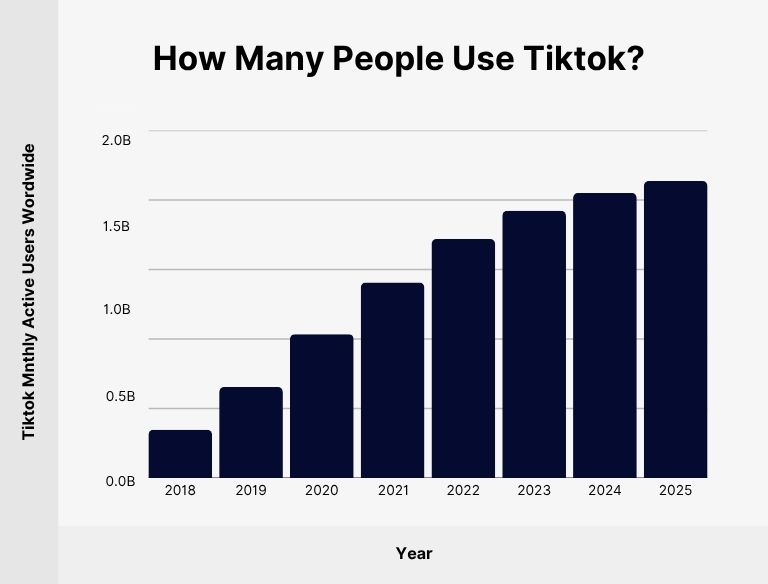
Projections further suggest that by the end of 2029, TikTok’s user base will grow to approximately 2.35 billion users, solidifying its place as one of the most influential platforms worldwide.
The table below shows TikTok’s registered users over the years:
Year |
Number of Registered Users |
Percentage Change |
|---|---|---|
2029 |
2.354 billion |
2.4% |
2028 |
2.299 billion |
2.2% |
2027 |
2.249 billion |
2.3% |
2026 |
2.198 billion |
2.9% |
2025 |
2.136 billion |
4.2% |
2024 |
2.050 billion |
6.7% |
2023 |
1.922 billion |
11.7% |
2022 |
1.719 billion |
22.2% |
2021 |
1.407 billion |
35.8% |
2020 |
1.035 billion |
58.6% |
2019 |
653.5 million |
88.3% |
2018 |
347.1 million |
– |
TikTok’s reach is impressive on a global scale.
Out of the 3.96 billion monthly active social media users worldwide, 26.26% use TikTok at least once a month.
Additionally, out of the 5.4 billion internet users worldwide, 19.26% are monthly active TikTok users, further highlighting the platform’s widespread influence.
Source: Statista
TikTok Users by Country
As of 2025, Indonesia holds the top spot with 165.1 million TikTok users, making it the largest TikTok audience globally. It is followed by the United States, with 137.9 million users, and Brazil, with 111.3 million.
Only these three countries have crossed the 100 million user mark, highlighting TikTok’s deep penetration into high-population, mobile-first regions.
It’s important to note that India, once TikTok’s largest market, is absent from this list. The Indian government banned TikTok in June 2020 due to national security and data privacy concerns. Before the ban, India had over 200 million users, making it a key part of TikTok’s early growth story.
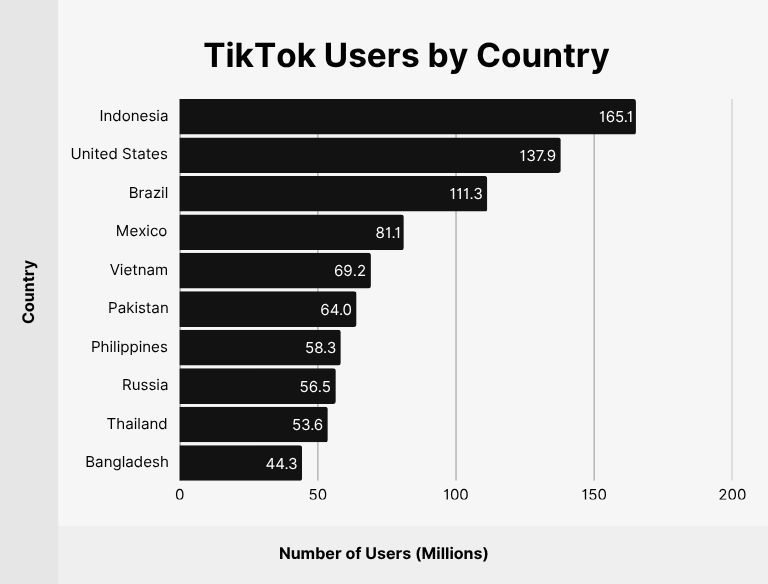
Here’s a breakdown of TikTok users by country based on the platform’s latest ad reach data:
Rank |
Country |
Number of Users (millions) |
|---|---|---|
1 |
Indonesia |
165.1 |
2 |
United States |
137.9 |
3 |
Brazil |
111.3 |
4 |
Mexico |
81.1 |
5 |
Vietnam |
69.2 |
6 |
Pakistan |
64.0 |
7 |
Philippines |
58.3 |
8 |
Russia |
56.5 |
9 |
Thailand |
53.6 |
10 |
Bangladesh |
44.3 |
The data reflects how TikTok’s growth is concentrated in Southeast Asia, Latin America, and select emerging markets, where mobile usage is high and short-form content thrives. Countries like Vietnam, Pakistan, and Bangladesh are fast becoming hotspots for both content creators and advertisers.
Source: Data Reportal
How Many Americans Use TikTok?
As of January 2024, TikTok has 170 million monthly active users in the U.S., up from 150 million in February 2023, according to TikTok CEO Shou Chew. That’s a major leap, showing how quickly the platform is growing.
In addition, a Pew Research Center study reveals that 33% of U.S. adults have used TikTok at least once, highlighting its widespread popularity across various demographics.
But that’s not all. eMarketer forecasts that by 2025, TikTok will have 117.9 million monthly active users in the U.S., which will represent 32.9% of the total U.S. population. This shows that TikTok is far from slowing down, it’s only getting bigger.
With this rapid growth, TikTok presents enormous opportunities for marketers and brands looking to engage with a massive, highly active audience.
Sources: TikTok, Pew Research Center, eMarketer
TikTok Monthly Active Users by Region
TikTok’s user base spans across continents, but the majority of its monthly active users (MAUs) come from Asia-Pacific, the Middle East, and Africa, making up more than 51.17% of the platform’s global activity.
This regional distribution highlights TikTok’s rapid adoption in emerging markets, where mobile-first usage and short-form video content dominate.
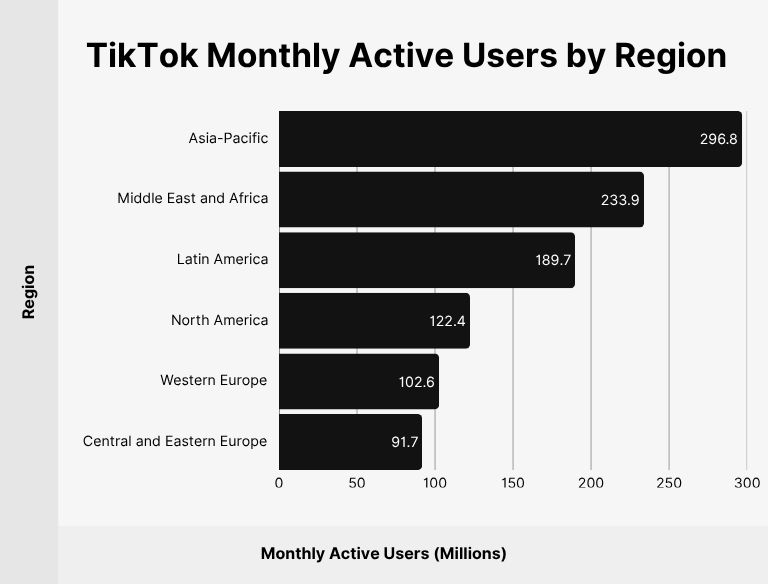
Below is a detailed breakdown of TikTok’s monthly active users by region:
Region |
Monthly Active Users (millions) |
Share of Global MAUs |
|---|---|---|
Asia-Pacific |
296.8 |
28.62% |
Middle East and Africa |
233.9 |
22.55% |
Latin America |
189.7 |
18.29% |
North America |
122.4 |
11.8% |
Western Europe |
102.6 |
9.89% |
Central and Eastern Europe |
91.7 |
8.84% |
Together, the Asia-Pacific region and the Middle East and Africa account for more than half of TikTok’s active user base, making them key regions for platform growth, creator discovery, and brand investment.
Source: eMarketer
TikTok Users by Gender
Globally, 55.7% of TikTok users are male, while 44.3% are female.
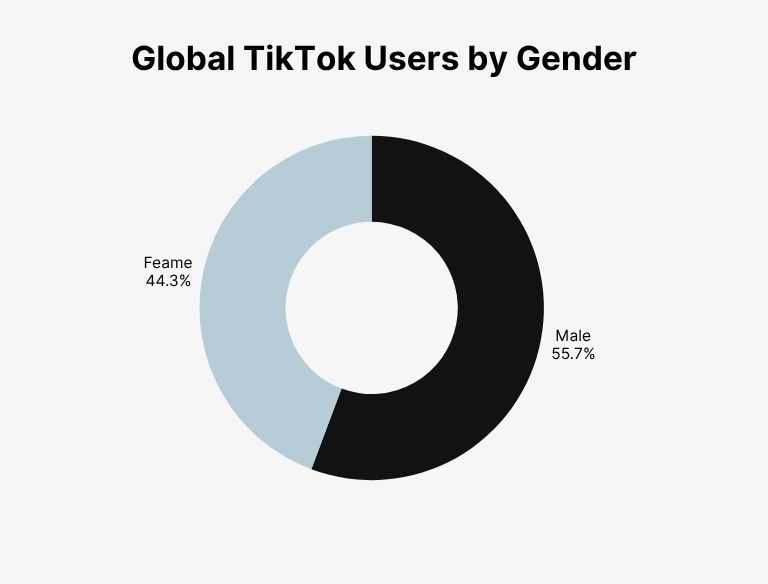
This indicates a slight male majority worldwide. However, the split is relatively even, showing that TikTok remains a platform with strong appeal across genders.
Gender |
Share of TikTok Users |
|---|---|
Male |
55.7% |
Female |
44.3% |
Source: DataReportal
US TikTok Users by Gender
In contrast, TikTok’s gender distribution in the United States is flipped. 55% of weekly TikTok users in the US are female, while 45% are male. This suggests that regional user patterns can vary significantly, and targeting strategies should reflect local demographic behavior.
Gender |
Share of Weekly TikTok Users |
|---|---|
Female |
55% |
Male |
45% |
Source: Industry Dive
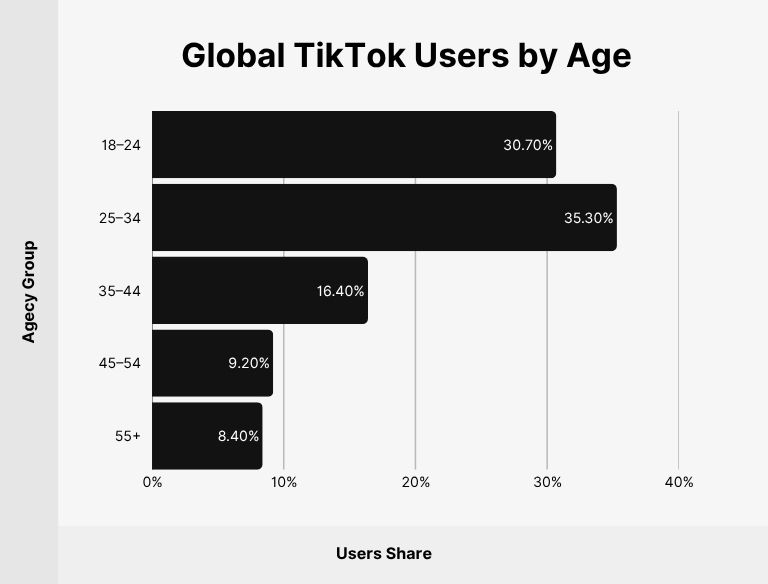
TikTok Users by Age
Younger users dominate TikTok globally, but older age groups are gradually making up a larger share, especially in the US.
Globally, TikTok is most popular among users aged 18 to 34, who make up 66% of the total user base.
The largest age group is 25 to 34, accounting for 35.3%, followed by 18 to 24, with 30.7%. Usage among those aged 45 and above is still relatively low, representing just 17.6% combined.
Let’s take a detailed look at the table:
Age Group |
Share of TikTok Users |
|---|---|
18–24 years old |
30.7% |
25–34 years old |
35.3% |
35–44 years old |
16.4% |
45–54 years old |
9.2% |
55+ years old |
8.4% |
Source: DataReportal
US TikTok Users by Age Group
In the United States, the age distribution is similar but with slight variation. More than half (55%) of weekly TikTok users are between 18 and 34 years old. The 25 to 34 group is the largest single segment, with 30%, followed by 18 to 24, with 25%. Notably, 14% of US users are aged 55 and above, a higher proportion than the global average.
Age Group |
Share of Weekly TikTok Users |
|---|---|
18–24 years old |
25% |
25–34 years old |
30% |
35–44 years old |
19% |
45–54 years old |
13% |
55+ years old |
14% |
Source: Industry Dive
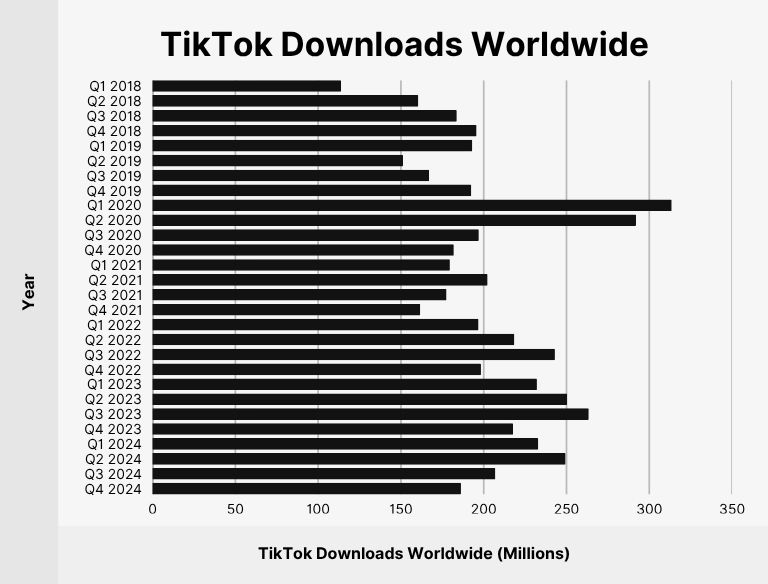
TikTok Downloads Worldwide
TikTok continues to dominate app stores globally, with billions of downloads fueling its rapid growth and expanding user base.
According to Sensor Tower estimates, TikTok downloads across the App Store and Google Play reached 875.67 million in 2024 alone.
In January 2025, TikTok was downloaded 49 million times worldwide on iOS and Android combined, showing the platform’s sustained popularity.
Here’s the full breakdown:
Date |
TikTok Downloads Worldwide (millions) |
|---|---|
Q1 2018 |
113.87 |
Q2 2018 |
160.48 |
Q3 2018 |
183.73 |
Q4 2018 |
195.67 |
Q1 2019 |
193.09 |
Q2 2019 |
151.25 |
Q3 2019 |
167.02 |
Q4 2019 |
192.48 |
Q1 2020 |
313.53 |
Q2 2020 |
291.99 |
Q3 2020 |
197.04 |
Q4 2020 |
181.93 |
Q1 2021 |
179.57 |
Q2 2021 |
202.34 |
Q3 2021 |
177.53 |
Q4 2021 |
161.65 |
Q1 2022 |
196.86 |
Q2 2022 |
218.48 |
Q3 2022 |
243.01 |
Q4 2022 |
198.34 |
Q1 2023 |
232.14 |
Q2 2023 |
250.34 |
Q3 2023 |
263.44 |
Q4 2023 |
217.72 |
Q1 2024 |
232.94 |
Q2 2024 |
249.45 |
Q3 2024 |
207.02 |
Q4 2024 |
186.26 |
Sources: Statista, Appfigures
Average Time Spent on TikTok
TikTok users spend more time on the app daily than on any other social network worldwide, making it a powerhouse for engagement.
Globally, users spend an average of 95 minutes per day on TikTok, surpassing all other leading platforms.
Here’s a detailed comparison of average daily time spent on TikTok and other major social networks as of Q4 2023:
Social Media |
Average Time Spent per Day |
|---|---|
TikTok |
95 minutes |
62 minutes |
|
X (Twitter) |
30 minutes |
Snapchat |
19 minutes |
In the United States, TikTok users spend slightly less time but still lead in engagement. According to eMarketer, US adults spend an average of 53.8 minutes per day on TikTok.
Average Time Spent per Day on Social Networks (US Adults):
Social Media |
Average Time Spent per Day |
|---|---|
TikTok |
53.8 minutes |
48.7 minutes |
|
X (Twitter) |
34.1 minutes |
33.1 minutes |
|
30.9 minutes |
|
Snapchat |
30.0 minutes |
24.1 minutes |
Sources: Financial Times, eMarketer
TikTok Revenue
TikTok’s revenue hit $23 billion in 2024, up 42.86% from $16.1 billion in 2023. This growth follows a massive 67.71% increase in 2023, up from $9.6 billion in 2022.
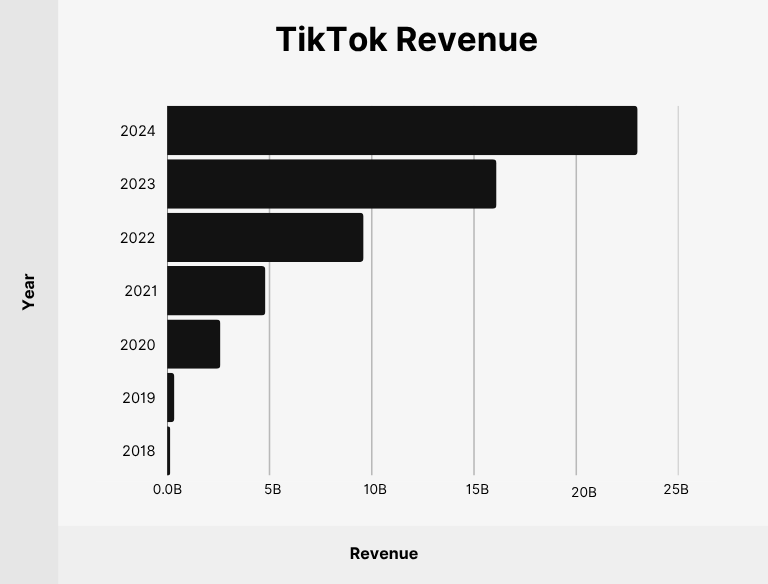
Here’s a breakdown of TikTok’s annual revenue and growth rates over the years:
Year |
Revenue |
Growth Rate |
|---|---|---|
2024 |
$23 billion |
+42.86% |
2023 |
$16.1 billion |
+67.71% |
2022 |
$9.6 billion |
+100.00% |
2021 |
$4.8 billion |
+84.62% |
2020 |
$2.6 billion |
+642.86% |
2019 |
$0.35 billion |
+133.33% |
2018 |
$0.15 billion |
– |
Source: Business of Apps
TikTok In-App Purchase Revenue
In 2024, TikTok generated $3.7 billion in in-app purchases, growing 25% from $2.96 billion in 2023.
TikTok and Douyin combined surpassed $6 billion in in-app revenue in 2024, becoming the first non-gaming apps to do so. In just Q4 2024, TikTok earned $1.9 billion from in-app purchases alone.
Here’s a breakdown of TikTok’s in-app purchase revenue and year-over-year growth:
Year |
Revenue |
Growth Rate |
|---|---|---|
2024 |
$3.7 billion |
+25.00% |
2023 |
$2.96 billion |
+16.54% |
2022 |
$2.54 billion |
+51.19% |
2021 |
$1.68 billion |
+79.85% |
2020 |
$934.24 million |
+543.30% |
2019 |
$145.22 million |
+461.41% |
2018 |
$25.86 million |
– |
Sources: Statista, TechCrunch
TikTok Ad Revenue Projections
TikTok’s global ad revenue is forecast to reach $33.1 billion in 2025, a 40.5% increase over 2024’s $23.6 billion.
By 2027, TikTok’s in-app revenue is expected to soar to $54 billion, a 17-fold increase from 2020’s $2 billion.
The US market will be a major contributor, projected to generate $9.5 billion in TikTok ad revenue in 2025.
Here’s a breakdown of TikTok’s global annual ad revenue and projected growth:
Year |
Ad Revenue |
Growth Rate |
|---|---|---|
2027* |
$54.0 billion |
+22.7% |
2026* |
$44.0 billion |
+32.7% |
2025 |
$33.1 billion |
+40.5% |
2024 |
$23.6 billion |
+30.7% |
2023 |
$18.0 billion |
+55.0% |
2022 |
$11.6 billion |
+191.0% |
2021 |
$4.0 billion |
+100.0% |
2020 |
$2.0 billion |
– |
Source: Oberlo
TikTok Climbs to 5th Place in Global Social Media User Rankings
As of February 2025, TikTok ranks as the 5th most-used social network worldwide, with 1.59 billion active users.
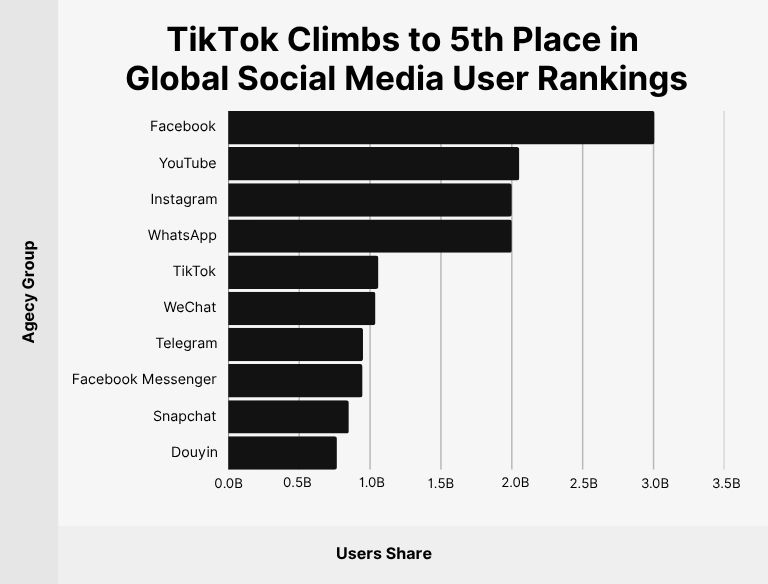
Here’s a breakdown of monthly active users for the top social networks globally:
Social Network |
Monthly Active Users Worldwide |
|---|---|
3.07 billion |
|
YouTube |
2.53 billion |
2 billion |
|
2 billion |
|
TikTok |
1.59 billion |
1.38 billion |
|
Telegram |
950 million |
Facebook Messenger |
947 million |
Snapchat |
850 million |
Douyin |
766 million |
Source: Statista
Most Followed Content Categories on TikTok
TikTok users engage most with entertainment, dance, and prank videos, making these the top content categories by views.
Here’s a breakdown of TikTok’s most popular content categories along with their total views (in billions):
Category |
Views (Billions) |
|---|---|
Entertainment |
535 |
Dance |
181 |
Pranks |
79 |
Fitness/Sports |
57 |
Home Reno/DIY |
39 |
Beauty/Skincare |
33 |
Fashion |
27 |
Recipes/Cooking |
18 |
Life Hacks/Advice |
13 |
Pets |
10 |
Outdoors |
2 |
This data highlights where creators can focus to maximize reach, with entertainment content dominating views.
The 50 Most Followed TikTok Users
The platform’s top influencers have follower counts that reach into the hundreds of millions.
Here’s a list of TikTok’s 50 most followed users, ranked by their follower counts:
Rank |
Influencer |
Followers |
|---|---|---|
1 |
Khabane Lame |
162.4 million |
2 |
Charli D’Amelio |
157.0 million |
3 |
MrBeast |
110.8 million |
4 |
Bella Poarch |
94.2 million |
5 |
Addison Rae |
88.6 million |
6 |
TikTok |
88.0 million |
7 |
Kimberly Loaiza |
83.2 million |
8 |
Zach King |
82.1 million |
9 |
Domelipa |
76.9 million |
10 |
The Rock |
76.4 million |
11 |
cznburak |
75.0 million |
12 |
Will Smith |
74.9 million |
13 |
BTS |
71.2 million |
14 |
Billie Eilish |
69.6 million |
15 |
Jason Derulo |
65.7 million |
16 |
Willie Salim |
64.2 million |
17 |
Selena Gomez |
58.1 million |
18 |
Kylie Jenner |
56.9 million |
19 |
YZ |
56.5 million |
20 |
Vilmei✨ |
55.6 million |
21 |
バヤシ🥑Bayashi |
55.4 million |
22 |
Dixie D’Amelio |
55.3 million |
23 |
Karol G |
55.0 million |
24 |
Spencer X |
54.9 million |
25 |
Real Madrid C.F. |
54.1 million |
26 |
Loren Gray |
53.5 million |
27 |
HOMA |
52.9 million |
28 |
Michael Le |
50.9 million |
29 |
Kris HC |
50.7 million |
30 |
Brent Rivera |
50.2 million |
31 |
ROSÉ |
50.1 million |
32 |
ESPN |
50.0 million |
33 |
blackpinkofficial |
49.3 million |
34 |
Carlos Feria |
46.9 million |
35 |
Netflix |
46.5 million |
36 |
Ria Ricis |
46.3 million |
37 |
FC Barcelona |
46.4 million |
38 |
Champions League |
46.2 million |
39 |
JoJo Siwa |
45.8 million |
40 |
Pongámoslo a Prueba |
45.8 million |
41 |
omari.to |
44.6 million |
42 |
Niana Guerrero |
44.2 million |
43 |
Junya/じゅんや |
44.2 million |
44 |
Joe Albanese |
44.2 million |
45 |
Barstool Sports |
43.2 million |
46 |
Katteyes |
43.1 million |
47 |
ROD🫠 |
42.7 million |
48 |
PSG |
42.7 million |
49 |
Avani |
42.2 million |
50 |
noelgoescrazy |
42.1 million |
At the top is Khabane Lame, boasting an impressive 162.4 million followers, making him the most followed TikTok creator.
Source: Social Blade
Most Viewed Hashtags on TikTok
Hashtags drive massive engagement on TikTok, with some reaching trillions of views.
Here’s a breakdown of the 20 most viewed hashtags on TikTok and their total views:
Hashtag |
Views (Trillions) |
|---|---|
#FYP |
55.41 |
#Foryou |
31.72 |
#Viral |
21.68 |
#Fypシ |
20.56 |
#Foryoupage |
19.56 |
#Parati (For you) |
8.43 |
#TikTok |
7.29 |
#Capcut |
6.11 |
#Fy |
6.08 |
#Trending |
5.39 |
#Funny |
4.25 |
#XYZBCA |
4.23 |
#Duet |
3.49 |
#fypシ゚viral |
2.97 |
#Viralvideo |
2.81 |
#Trend |
2.61 |
#Xuhuong (Trend) |
2.57 |
#Humor |
2.48 |
#اکسپلور (Explore) |
2.36 |
Pekomeh Дачи |
2.24 |
These hashtags highlight what content themes and trends are resonating most with TikTok’s global audience.
Conclusion
With over 1.9 billion users and trillions of hashtag views, TikTok has become a global hub for trends, brand discovery, and consumer behavior.
More than 51% of users now use the platform to research products a clear sign it’s no longer just for entertainment.
For brands and creators, showing up on TikTok isn’t optional. It’s where your audience already is. Consistency, creativity, and cultural relevance are key to winning on the platform.